MS Excel Project
One day local business owner contacted me to help with their excel spreadsheet, saying that they were struggling to get a daily and monthly summary data. The business was designed around production of a "Crushed stone" in a quarry outside of a city. They provided me with a excel spreadsheet that looked like in below picture.
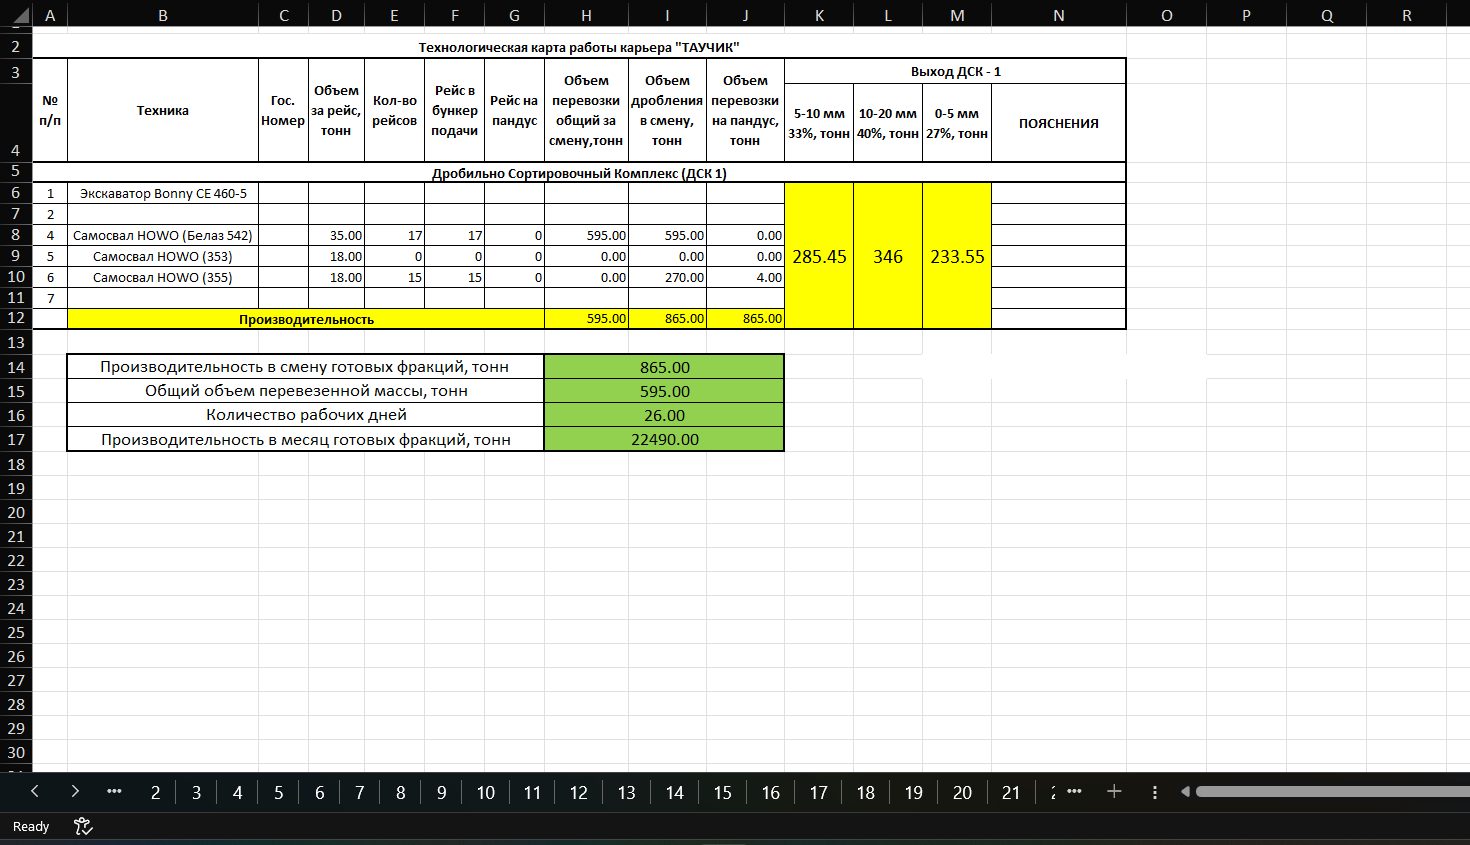
Basically there was a seperate table in a new sheet for a different day. So, there were 30 different sheets and tables for one month only. And there was no way to get summary out of it easy way.
I decided to contact business owner and clarify some questions I had and learned that they own one quarry, two Crushing and Screening Complex, one Excavator, three Dump trucks.
Their daily production goal was minimum 500 tonns of 5-20mm aggregates. But they did not know how much exactly they are producing in daily average. And they were struggling to calculate if it was viable to rent another Excavator and several Dump trucks to increase their production or at least avoid down time if one of the equipments broken down.
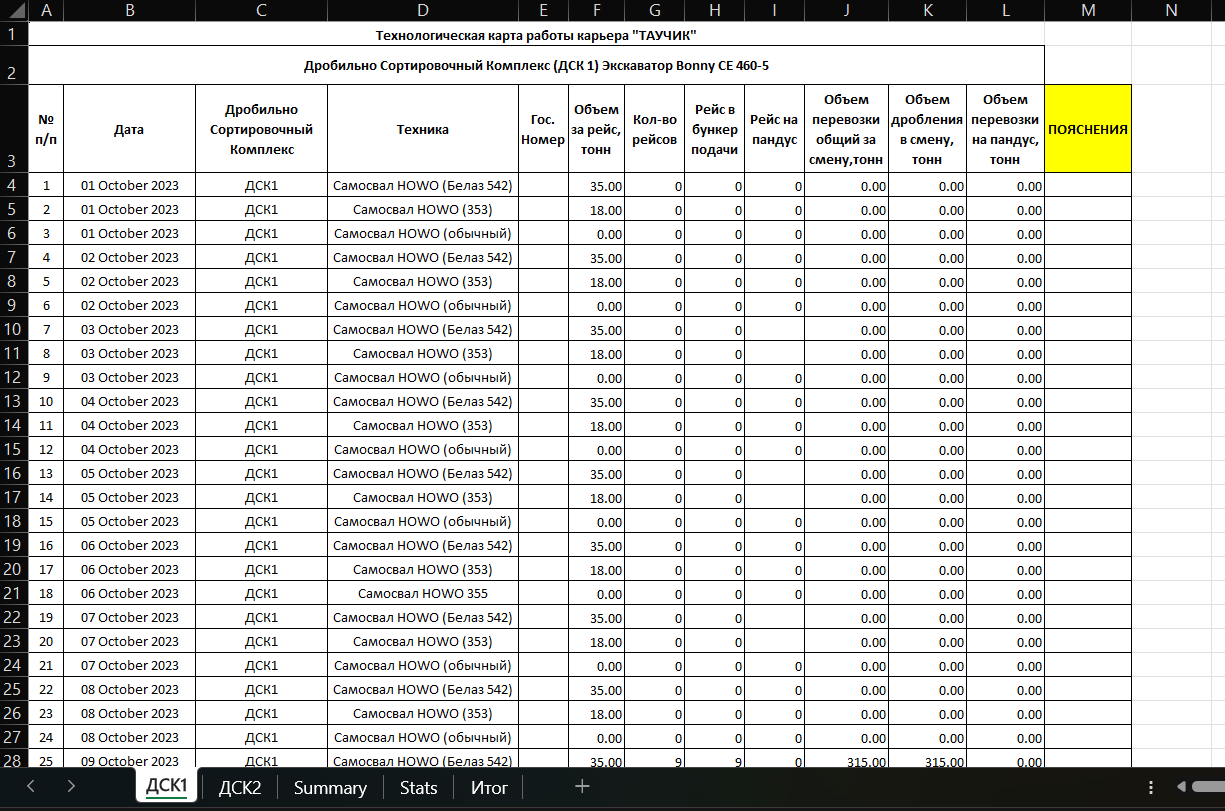
With the minimum information in hand I started creating a seperate tables for different Crushing and Screening Complexes. The table includes:
So, I have two tables for every Complex that look like in the picture below:
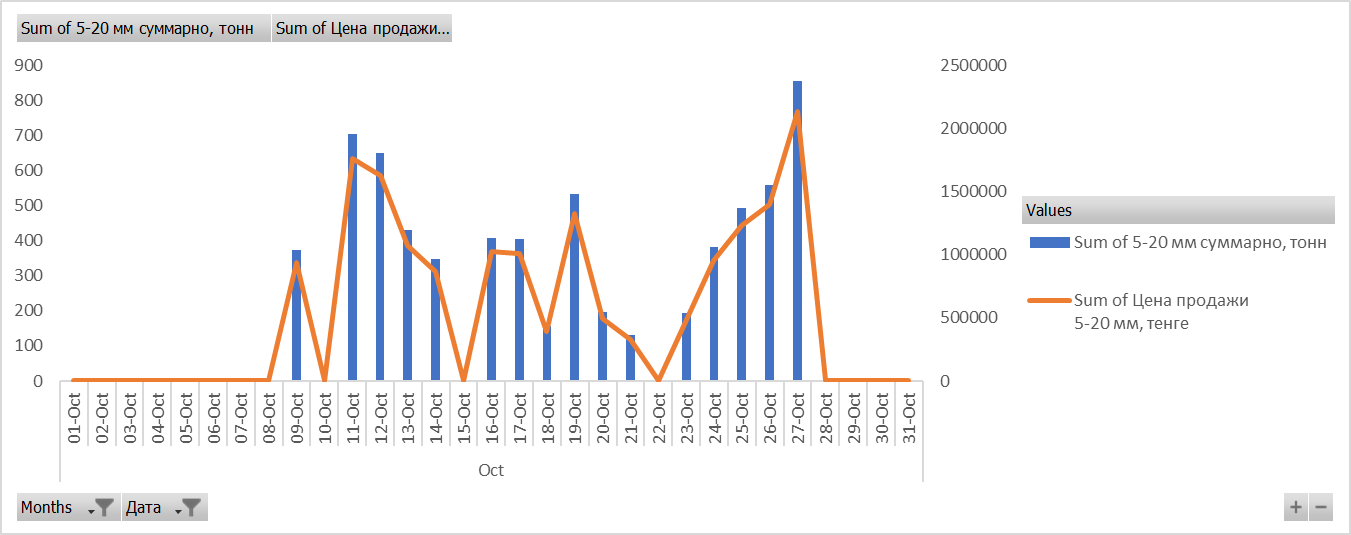
And the summary table must have been created to get a total number of aggregates created daily. I used a date as a starting point and used -sumif() function to get summary of aggregates two Complexes produced for each day. The summary table looks like in a picture below:
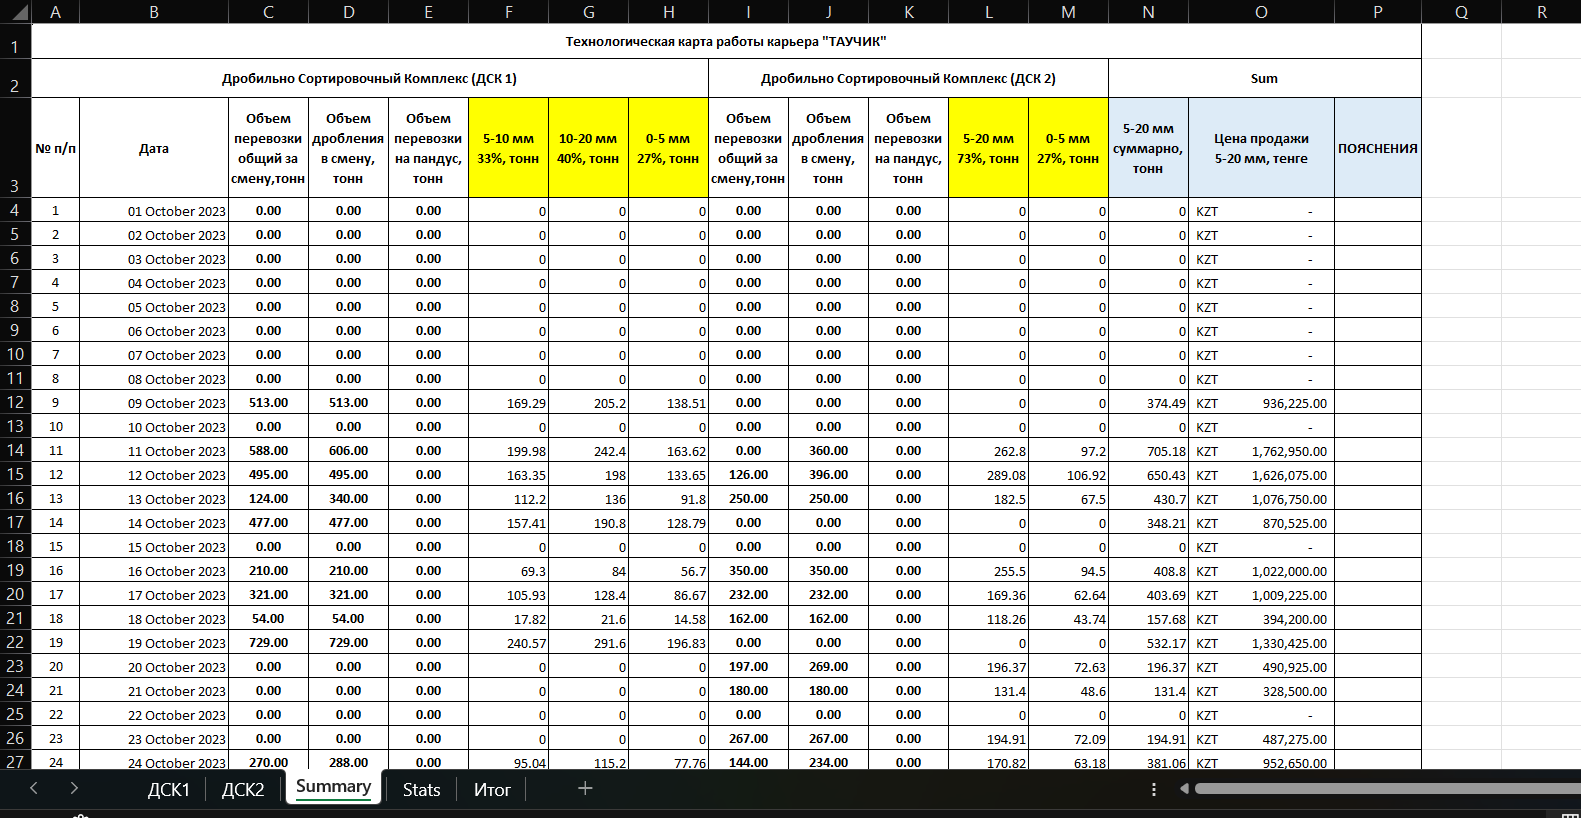
This table consists of aggregates from each Complex by day and by size. And from this table it will be possible to get a statistical data for every Excavator, every Dump truck and every Complex. And we can use PivotTable to do it much faster and easier.
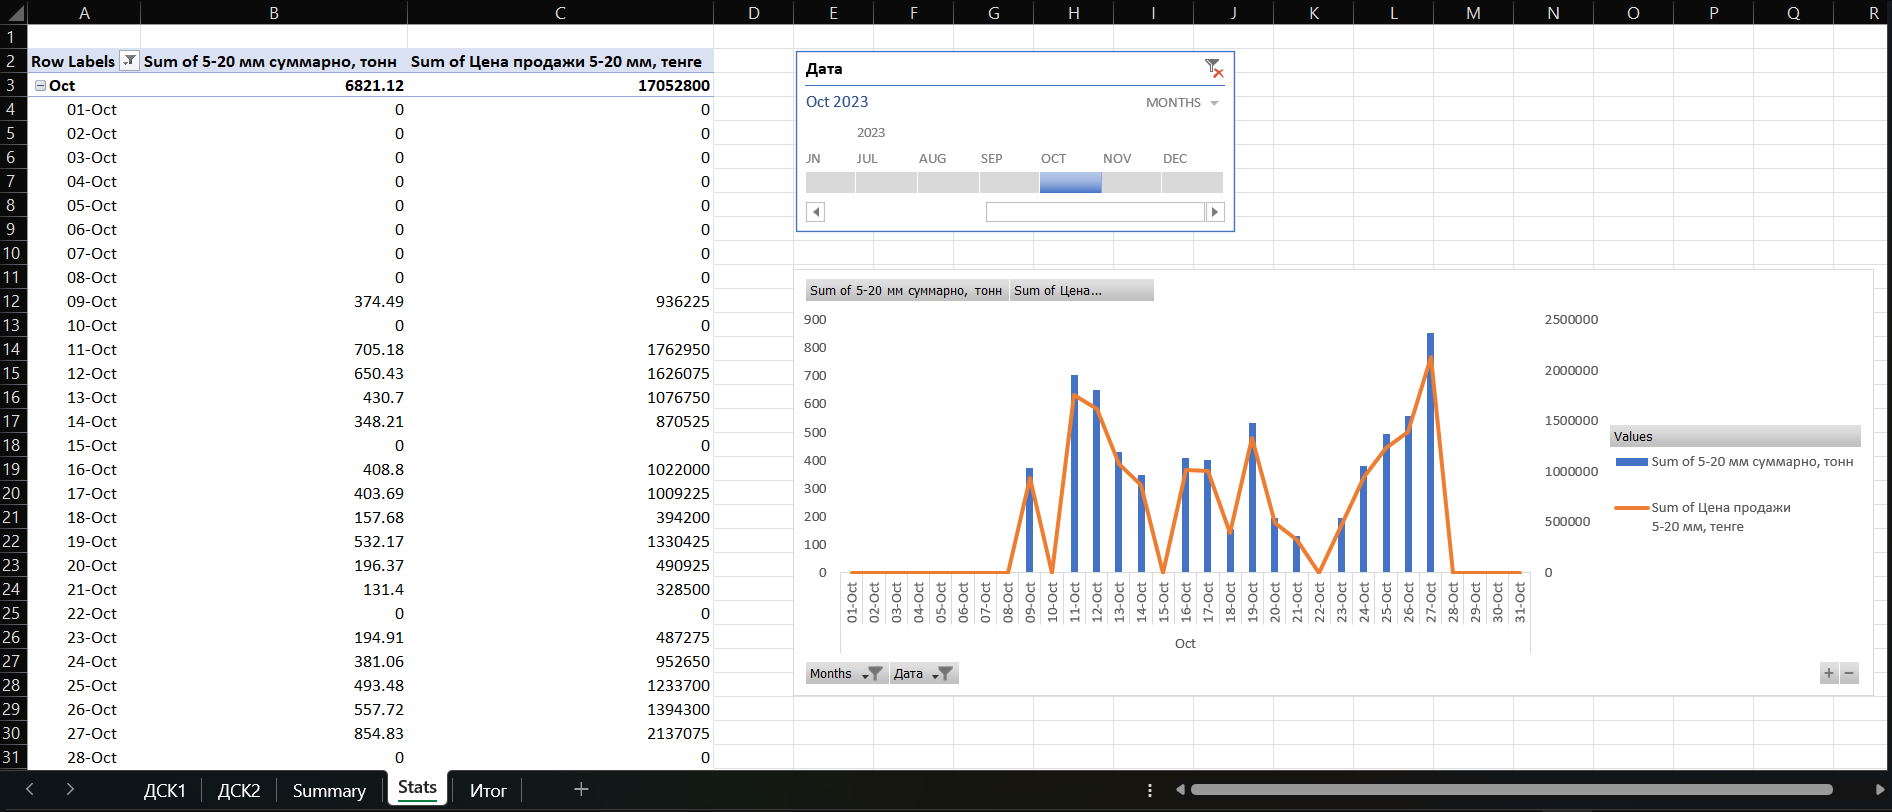
From this data it was obvious that business was not achieving their daily goal of 500 tonns of aggregates. In fact the daily average was 262 tonns. Which is almost two times less and mostly was due to frequent Excavator issues. Half of the month the Excavator was out of service. Since they had only one Excavator those days production was zero.
If they had second Excavator and kept production going with the daily average 500 tonns aggregates, the company would make 32,500,000.00 monthly. And their loss every month due to Excavator issues was 15,000,000.00.
The Excavator rent price was around 2 million a month. It means company could double their monthly revenue just renting extra Excavator.
NOTE: Names and data changed for demonstrative purposes.